Pie Chart Design Reference
This reference contains the Report Designer parameters and Report Type options for creating pie chart reports in the Report Designer tool.
Report Designer Parameters
| Section | Parameter | Definition |
|---|---|---|
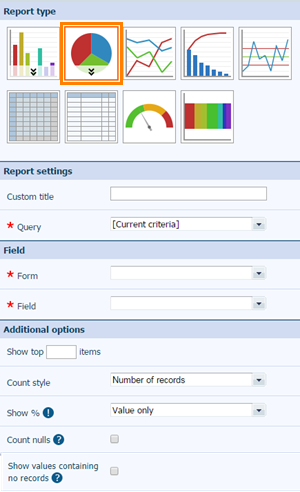
| Report Type | Select Pie Chart. | |
| Report Settings | Custom Title | Enter a title for the report. If you don't enter a title, one will be system generated. |
| Query | Either select the current criteria (your most recently defined search criteria) or select a saved query to extract the data for the report. | |
| Filters | Type | Optional. Double click an option in the Type drop-down list to filter the results returned by the query. |
| Field | Form | Select the section containing the data you want to show as the slices in the chart. |
| Field | Select a coded field or date field to use based on the module/link data section selected in the Form list. Note that you can also select extra fields. | |
| Date Option | Where a date field has been selected for , choose a date option from the drop-down list. See Report Date Options Reference. | |
For Additional Options parameters see Additional Options Reference.
Report Type Options
| Icon | Chart Type | Description |
|---|---|---|

|
Standard | Standard view shows the slices as a solid circle. |

|
Exploded | Exploded view shows the slices expanded and separated so
that it is easy to differentiate among them. The Exploded view is useful if your chart has multiple small slices that are hard to hover over or select. |