About Traffic Light Charts
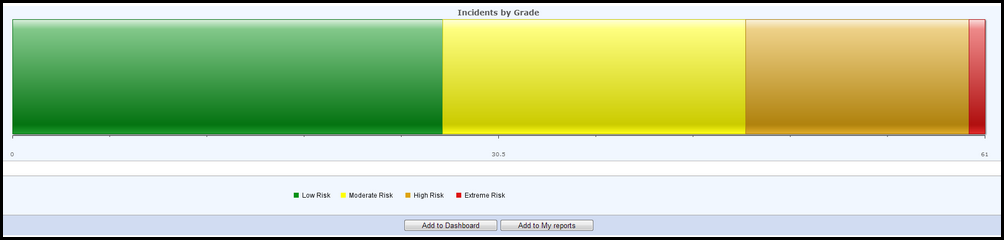
A traffic light chart is a single horizontal stacked bar chart that displays the sum total of each field as coloured bars, adding to a cumulative total across the bottom of the report. It can be useful as an indicator of proportionality. For example it could show the different levels of incident severity as a proportion of all incidents.
There can be as many different colours in a traffic light chart as there are fields. Default colours can be changed using the colour picker.