About Line Graphs
A line graph displays a series of data points, representing individual measurements, connected by straight line segments. The measurement points are ordered by their x-axis value and often used to visualize a trend in data overtime. For example a line graph could help to identify any trends in the number of falls occurring over the course of a year.
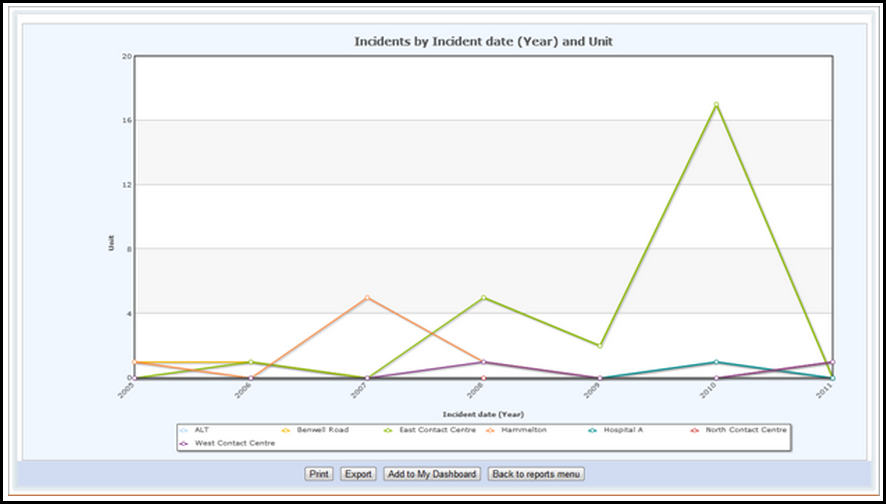
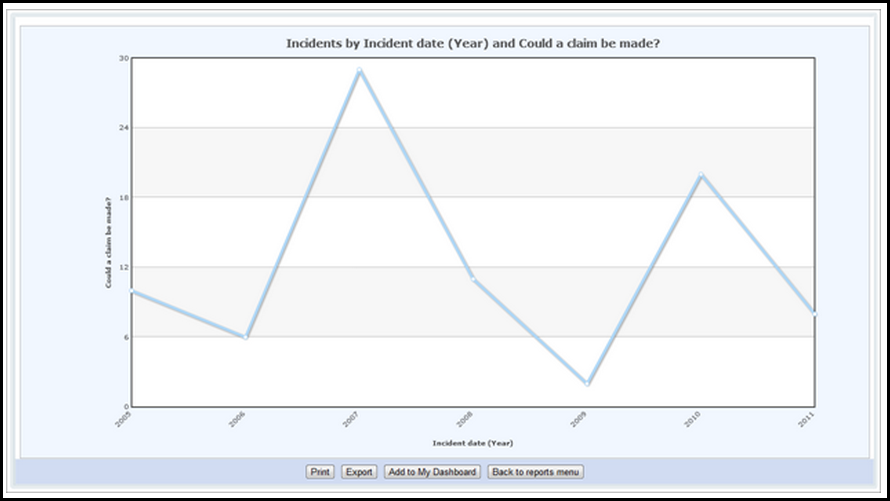
A single line graph will show the changes in one type of data. A multiple line graph will show the changes in several types of related data. On a multiple line graph, you can hide individual lines by deselecting labels in the key.
Single Line Graph
Multiple Line Graph