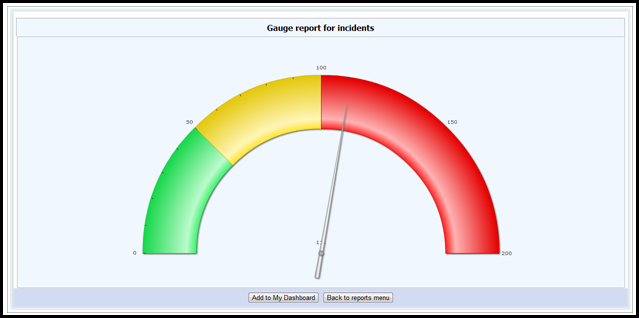
About Gauge Charts
A gauge chart is a representative visual report that shows where the total count of a selected event falls within three user-defined ranges. Colour-coded ranges show whether the event count falls within the defined good, fair or poor range. For example the total number of incidents or complaints in the reporting period versus the acceptable number of those events for that period.