About Bar Charts
A bar chart is a statistical report that consists of rectangular bars with lengths that are proportional to the values that they represent. Bar charts plot cumulative countable values such as the total number of incidents or complaints that occur during a specific period or in a specific location. You can also create a sum or average of a value field.
There are four different bar charts available in the application:
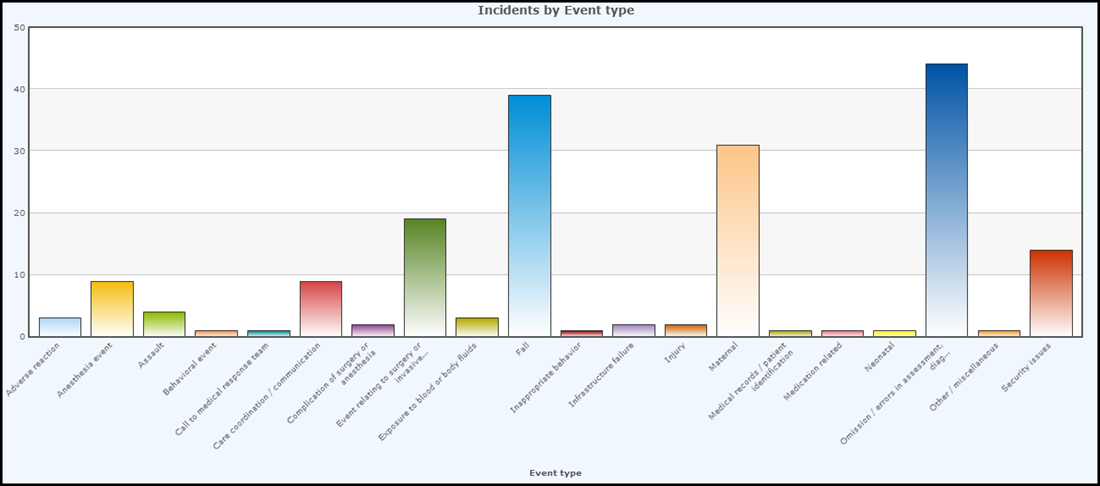
Vertical Bar Chart
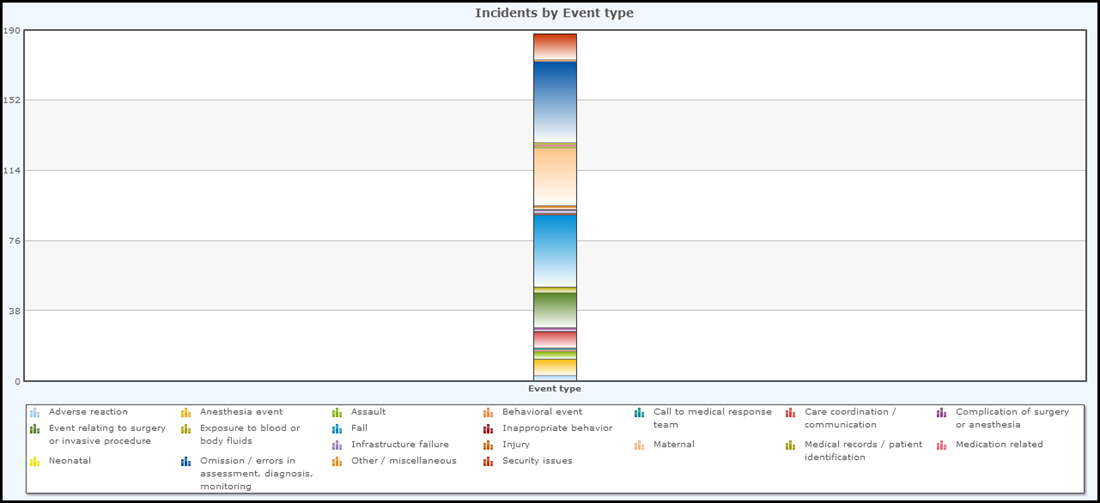
Stacked Vertical Bar Chart
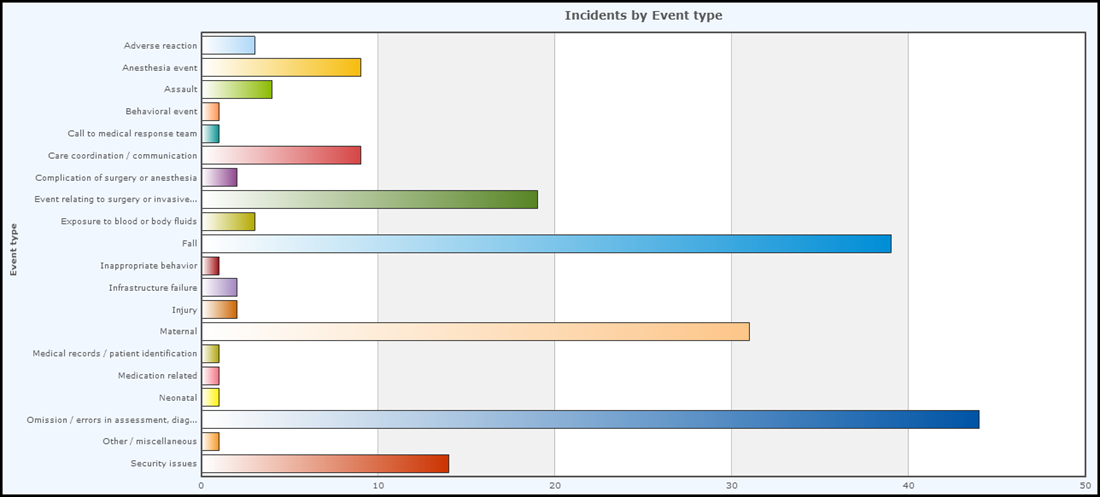
Horizontal Bar Chart
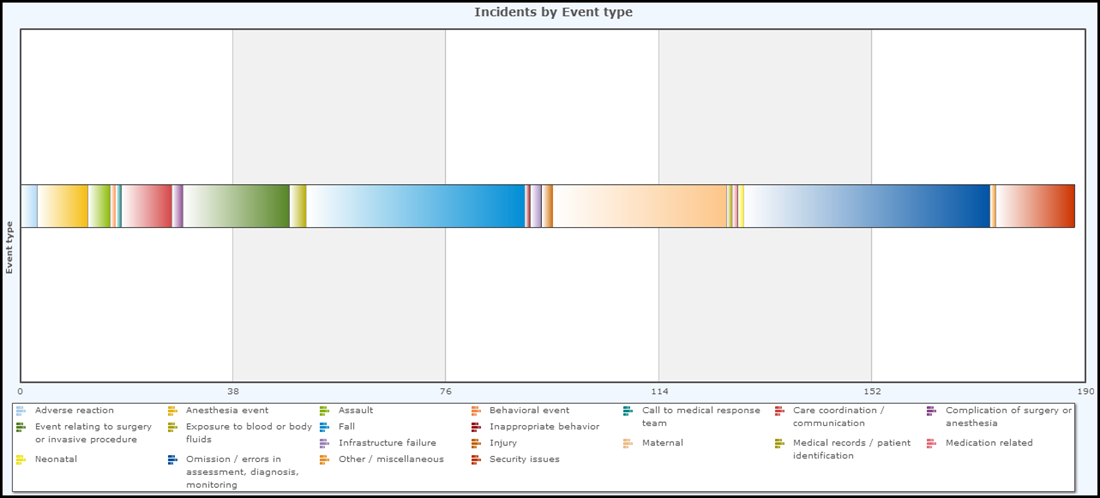
Stacked Horizontal Bar Chart